Behavioral biases are often the real source of losses: Most investment losses aren’t caused by bad markets — they’re caused by bad decisions made in good and bad markets alike, often triggered by emotions. Fear of missing out drives investors to chase performance at exactly the wrong time, while the sting of a paper loss triggers panic selling that converts temporary setbacks into permanent capital losses. These aren’t personality flaws; they are deeply wired cognitive responses that evolution built for survival — fight or flight — not for portfolio management. Understanding how emotions such as regret, pride, and fear systematically distort judgment is the foundation of everything we do. Without first mapping these behavioral traps, no amount of sophisticated tooling or strategy can protect a portfolio from its own decision-maker. Our research identifies the most costly biases investors face and builds the process guardrails that keep those biases from becoming expensive mistakes.
Drawdown control and strategy discipline is the process response: Once behavioral risk is understood, the next challenge is structural: how do you size and protect positions so that short-term volatility doesn’t force you out of a long-term thesis? Drawdown control is far more complex than it first appears — it must account for black swan price moves, expected return priors, hedging strategy gaps, legacy concentrated positions, persistents gap between claimed risk tolerance and actual investor behavior, path-dependent assets, and portfolio-level risk overlays. Most critically, an investor lose faith in their thesis due to short-term irrational dynamics, only to watch that position subsequently become highly profitable. The interaction between stop-loss placement and position sizing is one of the most under-examined variables in portfolio construction. Conventional practice treats them independently, but the relationship is multiplicative — a tight stop on an oversized position is not risk management, it is a forced liquidation waiting to happen. We engage continuously in drawdown control research and work with clients to develop frameworks that are genuinely consistent with how they actually behave under pressure, not how they imagine they will.
Portfolio Analytics is the accountability and measurement layer: Sound drawdown management requires a clear view of what your portfolio is actually doing — and most investors don’t have one. Conventional portfolio construction methods — mean-variance optimization, risk parity, efficient frontiers — share a common vulnerability: they are all sensitive, in different ways, to the instability of the risk covariance matrix and the difficulty of forecasting expected returns. Effective portfolio analytics starts with a dashboard that tells you the truth: not just returns and volatility in isolation, but how your positions are actually moving relative to each other and what risks you intended to take versus the ones you unknowingly accepted. That means surfacing hidden bets — a tilt toward a single overheated sector, an unintended bet on interest-rates — before markets surface them for you. We have built institutional-grade tools for understanding portfolio exposures, modeling return cyclicality, identifying regime shifts, and determining when changing conditions require action rather than patience.
A repeatable investment process is the goal: Analytics and risk management create a supportive foundation for excess returns aka alpha — but capturing it requires trading discipline. Thematic investment frameworks generate alpha only when paired with rigorous entry and exit criteria: a theme without a catalyst is a narrative, not a trade. Our research examines the construction of entry triggers that incorporate both macro regime identification and sentiment-adjusted valuation signals, drawing on a global database of crisis episodes to distinguish genuine dislocation from structural deterioration. Historically, the most asymmetric entry points cluster around periods of acute sentiment extremes — identifiable through positioning reports, options skew, valuation data, and flow-based indicators — where prices overshoot or undershoot fundamental justification and create opportunities for investors with a variant perception and the discipline to act on it. Strategy development is where behavioral awareness, drawdown discipline, and fundamental analysis clarity converge into a repeatable process — one designed to perform across market regimes, not just sunny weather markets.

Asset Allocation Tools
Expected Return Model. Expected Risk Model. Optimization tools include 1) Markowitz, 2) Black Litterman, 3) Hierarchical Risk Parity, 4) Universal Portfolios, 5) Follow the Leader. .

Backtesting Platform
Open source trade simulator, trading logic, transaction cost model, price data integration and evaluation tools for backtesting equities/ETFs/mutual funds or futures markets.
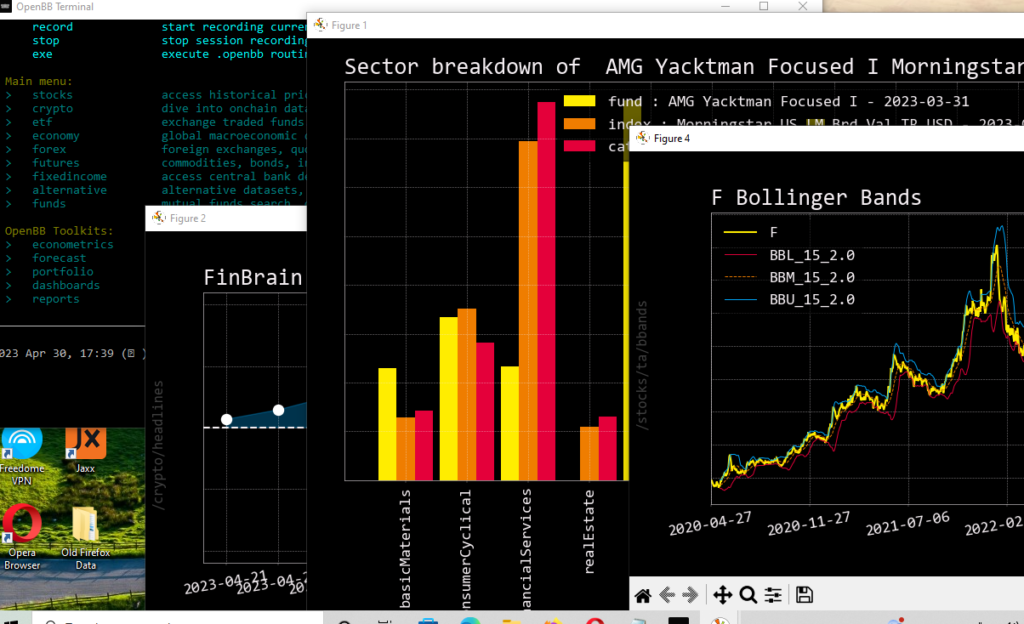
Data Terminal
Open source data terminal includes stocks, FX, funds, crypto, bonds, etc, financial statement data, statistical analyses, econometric analysis, scripting to automate commands
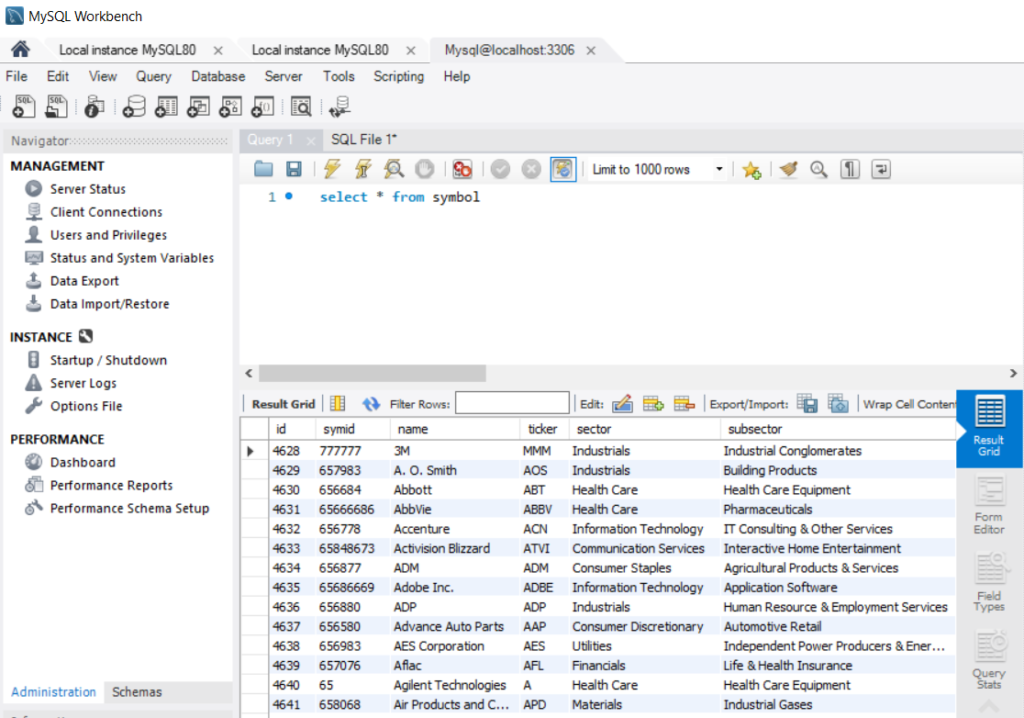
Security Master Database
Python codes for ETL and data management for storing and extracting security price and security meta data in a MySQL database for cost effectiveness and scalability.

“Many of the anomalies we initially exploited are intact, through they have weakened some. What you need to do is pile them up. You need to build a system that is layered and layered. And with each new idea, you have to determine, Is this really new, or is this somehow embedded in what we’ve done already? So you use statistical tests to determine that, yes, a new discovery is really a new discovery. Okay, now how does it fit in? Whats the right weighting to put in?”
JIM SIMONS